Keeping It Simple: Installing Heimdall as Our Application Dashboard


In our ongoing quest to refine and simplify our self-hosted stack, we decided to replace our growing collection of scattered bookmarks and memory-based links with something cleaner: Heimdall.
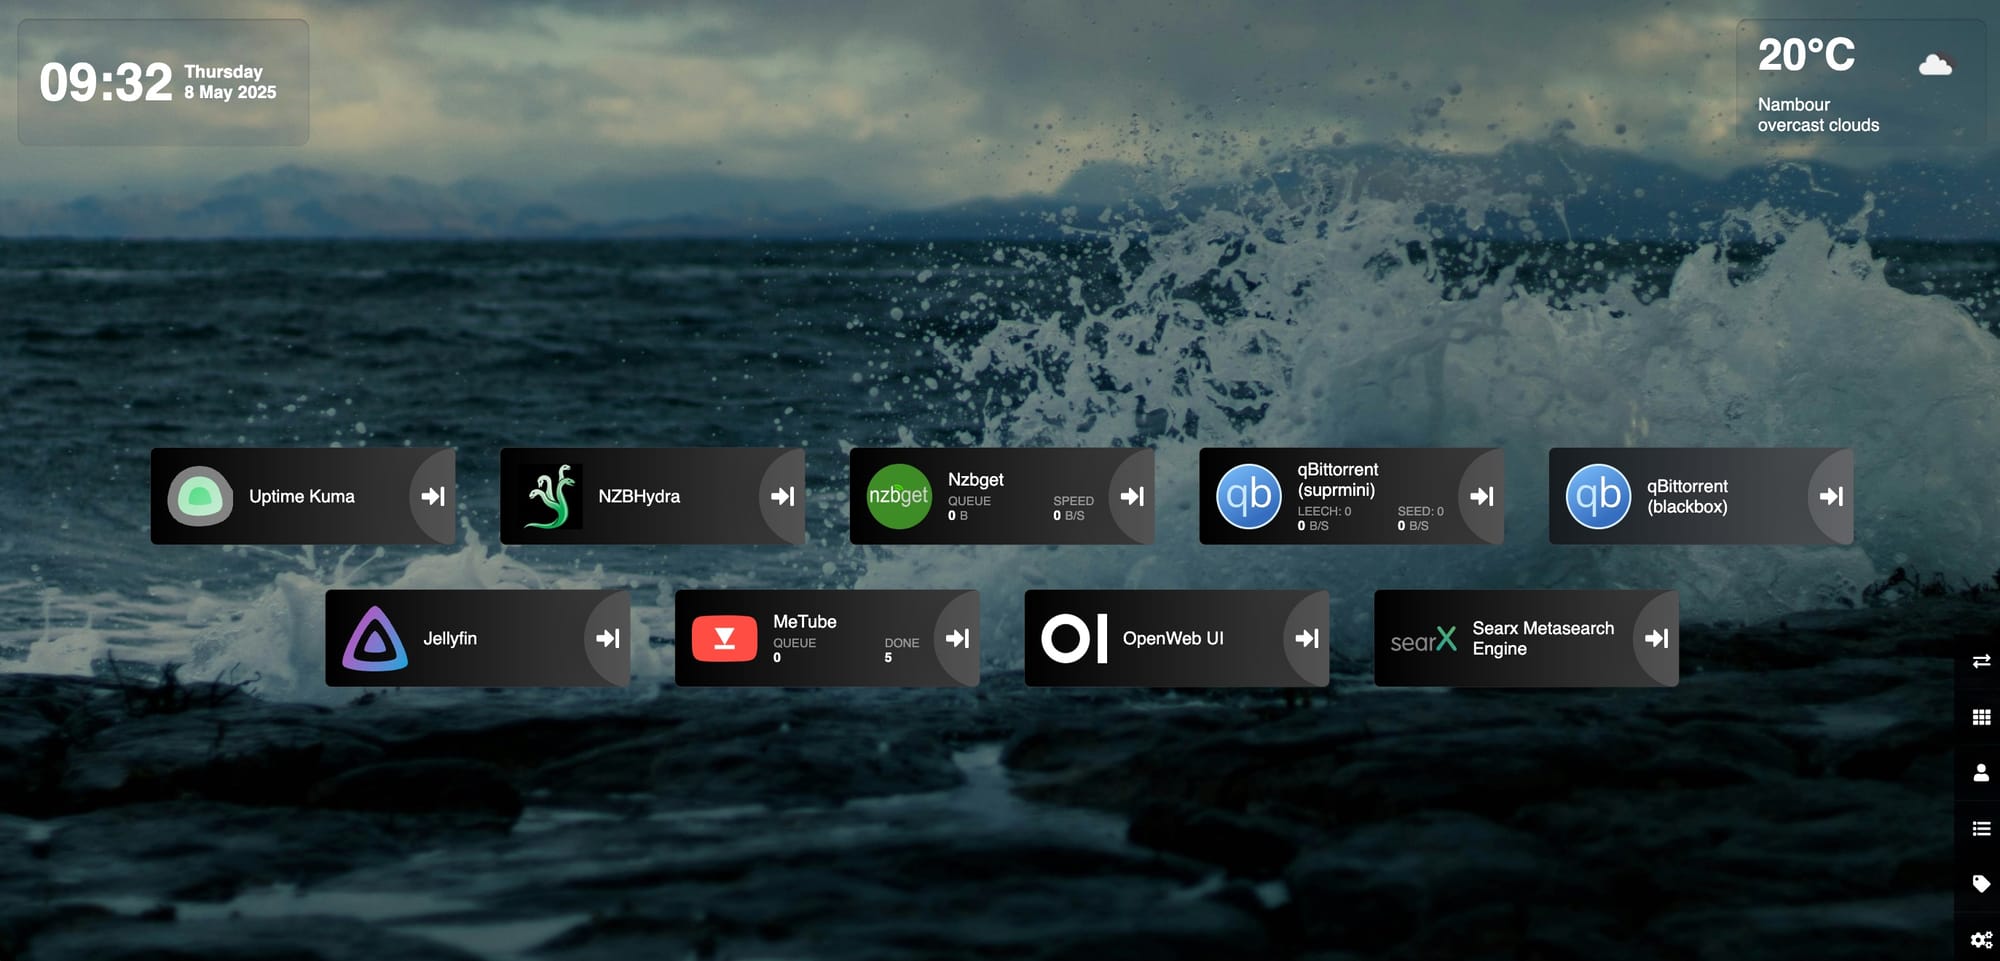
Heimdall is a lightweight, easy-to-use application dashboard that visually organizes and launches all the services we run on our network — from Uptime Kuma to Open WebUI to Jellyfin.
While popular dashboards like Dashy or Homer offer enormous customization (with YAML configs, JSON imports, and user theming), Heimdall’s appeal lies in its:
✅ Simplicity — no config files required, just a web interface.
✅ Speed — low resource use, quick to load.
✅ Visual clarity — clean icons, app categorization, and a no-fuss layout.
✅ Quick install — minimal setup compared to the YAML-heavy alternatives.
For this setup, we wanted something that “just works” out of the box without requiring days of fine-tuning. Heimdall delivered.
How We Installed It
We used this simple Docker command:
docker run -d \
  --name=heimdall \
  -e PUID=1000 \
  -e PGID=1000 \
  -e TZ=Australia/Brisbane \
  -p 8888:80 \
  -v /home/dean/heimdall/config:/config \
  --restart unless-stopped \
  linuxserver/heimdall
Once it was running, we accessed it at:
http://[yourserver]:8888
From there, adding and managing services is all point-and-click — no YAML files or complex configs required.
How We Customized It
We wanted to display the date, time, and local weather right in the dashboard header. To do that, we injected some custom CSS and JavaScript.
Custom CSS
.headerInfos {
  display: flex;
  justify-content: space-between;
  margin: 20px;
}

.divDate {
  order: 1;
  display: flex;
  align-items: center;
}

.divDate, .meteo {
  background-color: rgba(23, 42, 75, 0.1);
  border-radius: 10px;
  box-shadow: inset 0 1px 2px 0 rgba(0,0,0,.2);
  padding: 10px 20px;
}

.horloge, .ladate {
  display: inline-block;
  margin-right: 10px;
}

.ladate span {
  display: block;
  margin-bottom: 0;
}

.horloge {
  font-size: 3em;
}

.temperature {
  font-size: 2.5em;
}

.horloge, .ladate, .temperature {
  font-weight: bold;
}

.meteo {
  order: 2;
  display: flex;
  flex-direction: column;
}

.ville-temp-container {
  display: flex;
  justify-content: space-between;
}

.ville-temp-container.stacked {
  flex-direction: column;
  align-items: flex-start;
}

.temperature {
  padding-right: 50px;
}

.icon {
  margin-top: 5px;
}

.horloge, .ladate, .temperature, .ville, .description {
  color: white;
}

span.ville {
  padding-right: 50px;
}
Custom JavaScript
(replace [your API key] with your OpenWeatherMap API key)
const sortableElement = document.querySelector('.appheader');

function insertAfter(referenceNode, newNode) {
  referenceNode.parentNode.insertBefore(newNode, referenceNode.nextSibling);
}

function createAndInsertDiv(className, referenceNode) {
  var newDiv = document.createElement("div");
  newDiv.classList.add(className);
  referenceNode.appendChild(newDiv);
  return newDiv;
}

if (sortableElement) {
  var headerInfos = document.createElement('div');
  headerInfos.classList.add('headerInfos');
  insertAfter(sortableElement, headerInfos);

  var divDate = createAndInsertDiv('divDate', headerInfos);
  var timeDiv = createAndInsertDiv('horloge', divDate);
  var dateDiv = createAndInsertDiv('ladate', divDate);
  var meteoDiv = createAndInsertDiv('meteo', headerInfos);

  function afficherDateHeure() {
    const maintenant = new Date();
    const optionsJour = { weekday: 'long' };
    const optionsHeure = { hour: '2-digit', minute: '2-digit', hour12: false };
    const optionsDate = { year: 'numeric', month: 'long', day: 'numeric' };

    const jourFormatted = maintenant.toLocaleDateString('en-GB', optionsJour);
    const dateFormatted = maintenant.toLocaleDateString('en-GB', optionsDate);
    const heureFormatted = maintenant.toLocaleTimeString('en-GB', optionsHeure);

    dateDiv.innerHTML = '';

    var spanJourSemaine = document.createElement('span');
    spanJourSemaine.textContent = jourFormatted;
    dateDiv.appendChild(spanJourSemaine);
    timeDiv.textContent = heureFormatted;
    dateDiv.appendChild(document.createTextNode(dateFormatted));
  }

  function afficherMeteo(cityId) {
    const apiKey = '[your API key]';
    fetch(`https://api.openweathermap.org/data/2.5/weather?id=${cityId}&appid=${apiKey}&units=metric&lang=en`)
      .then(response => response.json())
      .then(data => {
        const temperature = Math.round(data.main.temp);
        const ville = data.name;
        const icon = data.weather[0].icon;
        const description = data.weather[0].description;

        meteoDiv.innerHTML = `
          <div class="ville-temp-container">
            <div class="temperature">${temperature}°C</div>
            <div class="icon"><img src="http://openweathermap.org/img/wn/${icon}.png"></div>
          </div>
          <div class="ville-temp-container stacked">
            <div class="ville">${ville}</div>
            <div class="description">${description}</div>
          </div>`;
      })
      .catch(error => {
        console.error('Error fetching weather data', error);
        meteoDiv.textContent = 'Unable to fetch weather';
      });
  }

  afficherDateHeure();
  afficherMeteo(2155862);
  setInterval(afficherDateHeure, 1000);
}
Reflection
Honestly, the simplicity surprised us.
After spending weeks fine-tuning services like Dashy in past projects, Heimdall feels refreshingly minimal.
It’s not the right tool if you want hyper-customization or deep integrations, but if you need a beautiful, functional landing page for your self-hosted stack, it’s hard to beat.
Plus, it’s easy for family or non-technical users to navigate — no need to explain what YAML or JSON is!
Screenshot